
Modern outdoor charging infrastructure, marine vessel bridge helms, automated mining machinery, and agricultural guidance consoles require human-machine interface screens that maintain high contrast under intense solar illumination. When specifying an industrial display, system integrators must decide between two fundamental manufacturing methodologies: traditional perimeter air-gap tape bonding or full optical wet bonding (using Optically Clear Adhesive, OCA, or Liquid Optically Clear Adhesive, LOCA). While air-gap assemblies offer slightly lower initial manufacturing costs, their optical performance degrades dramatically in outdoor environments.
Operating an unbonded air-gap display under direct sunlight (reaching 80,000 to 100,000 lux) produces severe optical washouts. Internal air-glass boundaries cause intense internal glare that overwhelms backlight luminance, rendering critical SCADA graphs and navigation contours invisible. Furthermore, humid ambient cycles draw moisture into the internal air cavity, causing permanent morning dew condensation. Evaluating optical bonding vs. air gap requires analyzing Fresnel reflection losses, ambient contrast ratio (ACR) dynamics, and Arrhenius polymer thermal aging.
1. Fresnel Interface Reflectance & Ambient Contrast Ratio (ACR) Analysis
When light travels between materials of differing refractive indices, part of the wave reflects at each interface boundary in accordance with Fresnel’s reflection law:
Fresnel Reflection & Multi-Interface Glare Modeling: Single Interface Reflectance: R = [ (n_1 – n_2) / (n_1 + n_2) ]^2 Where: – Cover Glass Refractive Index: n_glass = 1.52. – Ambient Air Cavity Refractive Index: n_air = 1.00. – Top LCD Polarizer Refractive Index: n_polarizer = 1.50. Air-Gap Configuration (Two Unmatched Boundaries): Interface 1 (Glass to Air): R_1 = [ (1.52 – 1.00) / (1.52 + 1.00) ]^2 = (0.52 / 2.52)^2 ≈ 0.0426 (4.26%). Interface 2 (Air to Polarizer): R_2 = [ (1.00 – 1.50) / (1.00 + 1.50) ]^2 = (-0.50 / 2.50)^2 ≈ 0.0400 (4.00%). Total Cumulative Internal Reflection Loss: R_total ≈ 1 – (1 – R_1) × (1 – R_2) = 1 – (0.9574 × 0.9600) ≈ 0.0809 = 8.09%. Optical Bonding Configuration (Matched Index LOCA/OCA Polymer n_polymer = 1.49): Glass to Polymer: R_1 = [ (1.52 – 1.49) / (1.52 + 1.49) ]^2 = (0.03 / 3.01)^2 ≈ 0.0001 (0.01%). Polymer to Polarizer: R_2 = [ (1.49 – 1.50) / (1.49 + 1.50) ]^2 = (-0.01 / 2.99)^2 ≈ 0.00001 (0.001%). Result: Optical bonding eliminates over 99.8% of internal interface reflections, preserving high optical contrast.
Under 100,000 lux direct solar illumination, an unbonded 1500-nit display delivers an Ambient Contrast Ratio of only 1.56:1, appearing faded and washed out. An optically bonded 1500-nit panel achieves an Ambient Contrast Ratio of 10.33:1, delivering razor-sharp text and high-contrast graphical telemetry.
To eliminate solar washouts and guarantee outdoor readability across all lighting angles, equipment builders standardize on the 10.1″ Full Waterproof Android Panel PC (Optical Bonding), which incorporates full optical wet bonding combined with chemically etched anti-glare front glass.
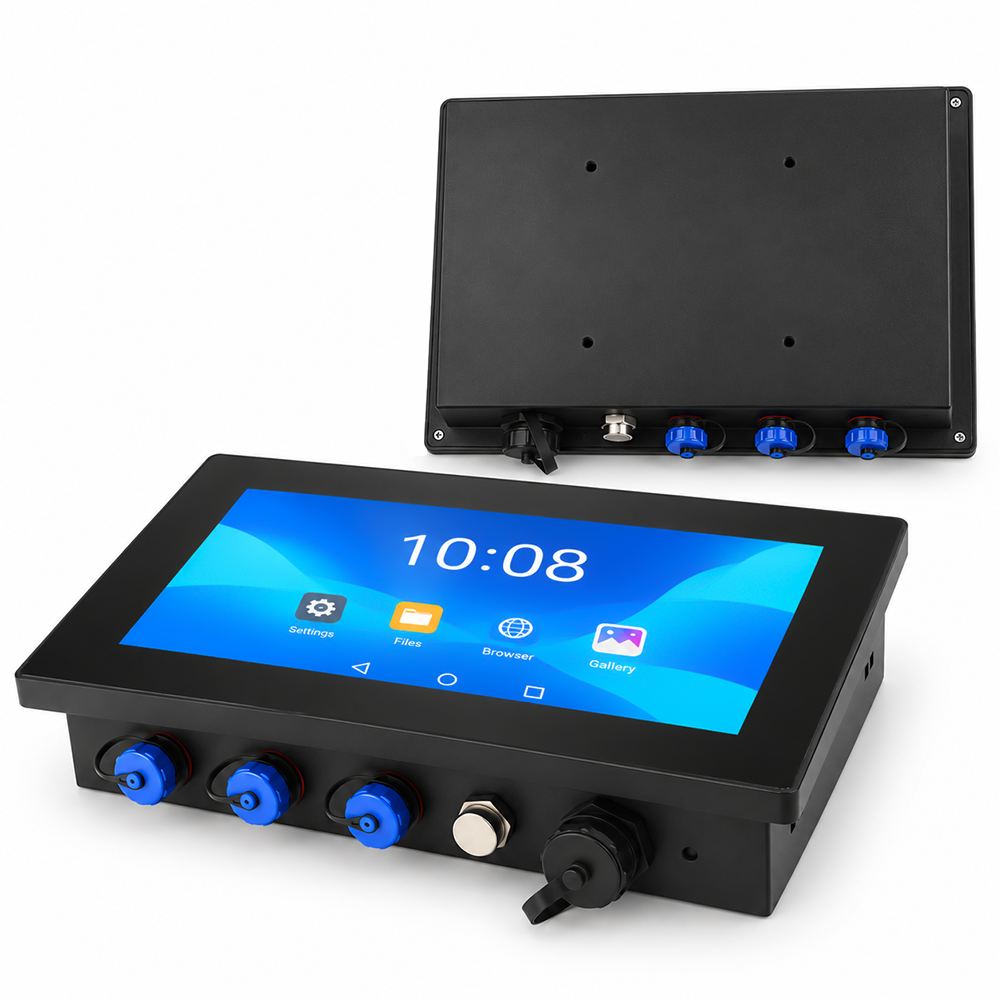
10.1″ Full Waterproof Optical Bonding Panel PC
Designed for outdoor EV charging plazas, marine navigation helms, and high-glare industrial kiosks. Features 1000 nits high luminance, full optical wet bonding eliminating internal air gaps, chemically etched anti-glare glass, full IP65 waterproof sealing, and fanless Android architecture.
2. Anti-Condensation Hermeticity & Impact Energy Dissipation
Beyond optical contrast, optical bonding provides essential structural and environmental benefits:
- Elimination of Dew-Point Internal Fogging: Air-gap displays contain trapped air volume. When temperature drops rapidly at night, internal humidity condenses on the cold inner glass surface. Optical bonding completely fills this space with solid polymer, physically eliminating internal moisture cavities.
- 300% Higher Mechanical Impact Resistance: In an air-gap display, front cover glass deflects into open space when struck, breaking easily. An optically bonded display bonds the cover glass, adhesive, and LCD into a laminated monolithic composite, absorbing shock up to IK09 standards.
- Enhanced Thermal Dissipation to Outer Glass: The solid optical adhesive layer acts as a thermal conduction bridge, transferring heat from the LCD surface directly into the front cover glass for natural convective cooling.
Optical Bonding vs. Air-Gap Engineering Comparison
| Engineering Parameter | Standard Air-Gap Assembly | Engineered Optical Wet Bonding |
|---|---|---|
| Internal Reflection Loss | ≈ 8.09% (Severe double-interface glare) | ≤ 0.02% (Virtually zero internal reflections) |
| Sunlight ACR (100,000 Lux) | 1.56 : 1 (Faded, difficult to read) | ≥ 10.33 : 1 (Razor-sharp industrial contrast) |
| Internal Condensation Fog | Frequent condensation during temperature drops | 100% Condensation-free (Zero internal air gap) |
| Mechanical Shock Absorption | Low (Cover glass flexes and shatters) | High (Laminated monolithic stack resists IK09) |
| Parallax Viewing Error | Noticeable gap between finger and pixel layer | Zero optical parallax (Direct pen/touch tracking) |
3. Real-World Field Case: Coastal EV Fast-Charging Kiosk Network
An electric vehicle charging network deployed 60 outdoor DC fast chargers along the Mediterranean coast of Spain. The initial chargers utilized standard air-gap touch displays. Within 4 months, morning humidity caused internal glass condensation that took hours to clear, and direct summer sunlight washed out payment confirmation screens, leading to customer abandoned transactions. After upgrading the kiosks to optically bonded industrial panel PCs, the operator achieved zero condensation incidents and 100% screen readability across summer peak temperatures exceeding 42°C.
Standardizing outdoor interactive terminals and marine bridge consoles on optically bonded displays ensures high daylight readability and eliminates internal condensation failures. Contact INNODA’s optical engineering support team to request spectrophotometer reflectance curves, optical bonding reliability test logs, and custom touchscreen samples.